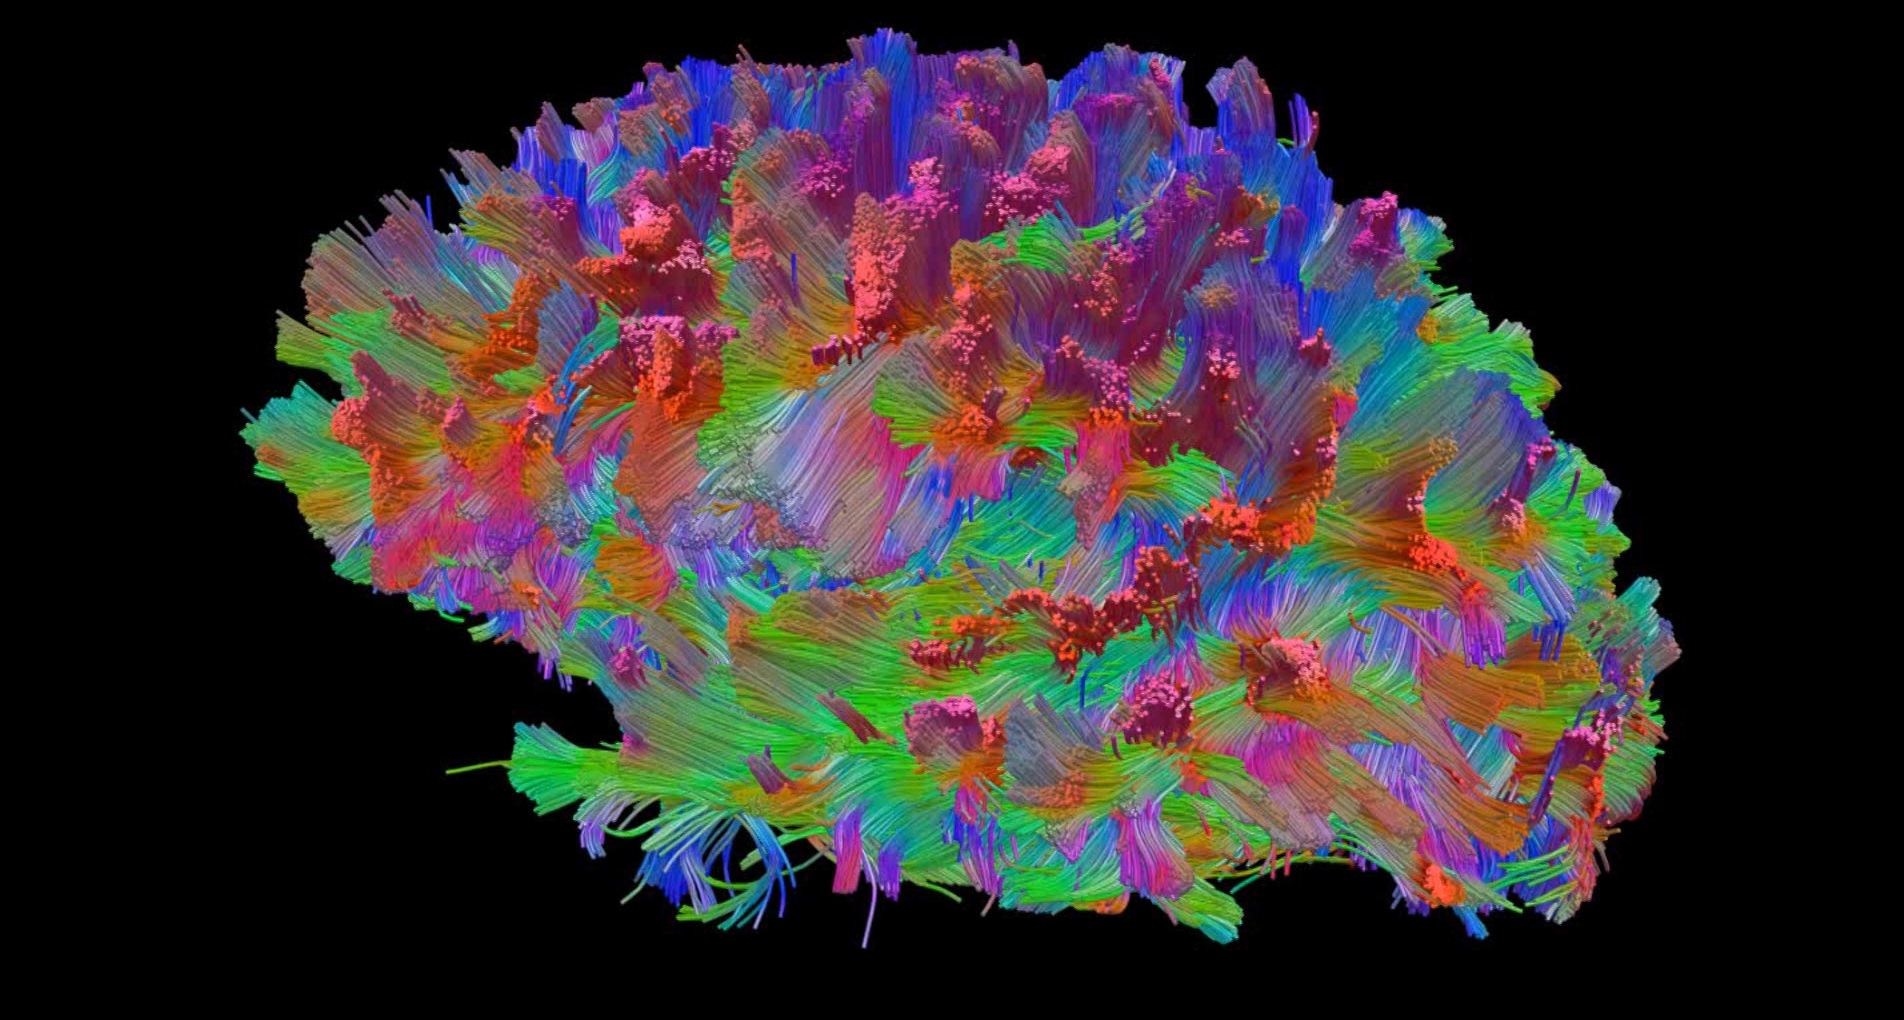
VIRAL ENGINE — The Full Guide
How to engineer a viral video using AI that simulates how your brain reacts to every second of it
What you're getting: A step-by-step setup for Meta's TRIBE v2 brain model + how to connect it to Claude to compare up to 10 video versions and find the winner. Zero coding required.
What is TRIBE v2?
Meta's AI research team (FAIR) just open-sourced a model called TRIBE v2.
It was trained on 1,115 hours of fMRI brain scans from 720 real volunteers — people who watched movies, listened to podcasts, and read text while their brain activity was recorded at high resolution inside an MRI machine.
TRIBE v2 learned the patterns. Now it can predict how a human brain responds to any video — without putting anyone in an MRI machine.
You give it a video. It tells you — second by second — which brain regions are lighting up and which are going dark.
- When attention is spiking
- When engagement flatlines
- When a moment gets encoded into memory
- When the viewer is about to scroll
Meta's own research shows TRIBE v2's predictions are more accurate than a single real brain scan — because real scans are noisy (heartbeats, movement, device artifacts). The model strips all that out.
They open-sourced everything. It's completely free.
Paper: TRIBE: TRImodal Brain Encoder — arXiv 2507.22229Meta blog: Introducing TRIBE v2License: CC BY-NC 4.0 (free for non-commercial use)
What You'll Need (All Free)
| Tool | What it's for | Cost |
|---|---|---|
| Google Colab | Runs the model in the cloud — no computer required | Free (Pro recommended) |
| Hugging Face account | Download the model weights | Free |
| Claude | Compare your video versions and tell you the winner | Free tier works |
| Your video file | What you're analyzing | — |
Part 1: One-Time Setup (15–20 min)
if you a visual learner you can also follow this simple guide
Step 1 — Open the Official Colab Notebook
Click this link to open Meta's official demo notebook:
This is Meta's own notebook. You don't need to write any code — every cell is already written for you.
Step 2 — Switch to a GPU
The model needs a GPU to run. Here's how to get one:
- In the top menu, click Runtime
- Click Change runtime type
- Under "Hardware accelerator", select T4 GPU
- Click Save
Tip: If you see errors about running out of memory later, upgrade to Colab Pro ($10/month) and select A100 GPU instead. The full TRIBE v2 model is large (≈30GB of weights loaded at once). T4 works for shorter videos; A100 is more reliable.
Step 3 — Create a Hugging Face Account
- Go to huggingface.co
- Sign up for a free account
- After signing in, click your profile picture → Settings → Access Tokens
- Click New Token
- Give it any name (e.g.
tribe-token)
- Set permission to Read
- Click Create token and copy it — you'll need this in a minute
Step 4 — Request Llama Model Access
TRIBE v2 uses Meta's Llama 3.2 model to process any text in your video. Llama is gated — you need to request access first.
- Go to the Llama 3.2 model page on Hugging Face
- You'll see a form asking you to agree to Meta's terms
- Fill it out and submit
- Wait for approval — usually takes 30 min to 2 hours
- You'll get an email when you're approved
You only need to do this once. After approval, your token automatically has access.
Step 5 — Add Your Token to Colab
Back in your Colab notebook:
- Look at the left sidebar and click the 🔑 key icon (Secrets)
- Click Add new secret
- In the "Name" field type:
HF_TOKEN
- In the "Value" field, paste the token you copied from Hugging Face
- Toggle on Notebook access
Step 6 — Install the Model
In the notebook, find the first code cell that looks like this:
!uv pip install "tribev2[plotting] @ git+https://github.com/facebookresearch/tribev2.git"Click the ▶ play button on that cell to run it. It will install all the required packages.
When it finishes, you'll see a message asking you to restart the runtime. Do that:
- Click Runtime → Restart session
- Do NOT run the install cell again after restarting
Part 2: Running Your First Video
Step 7 — Load the Model
Run the next cell in the notebook:
from tribev2.demo_utils import TribeModel, download_file
from tribev2.plotting import PlotBrain
from pathlib import Path

CACHE_FOLDER = Path("./cache")

model = TribeModel.from_pretrained(
    "facebook/tribev2",
    cache_folder=CACHE_FOLDER,
)
plotter = PlotBrain(mesh="fsaverage5")
This downloads the model weights and gets everything ready. It will take 2–5 minutes the first time.
Step 8 — Upload Your Video
The notebook includes a sample video by default. To use your own video, find the cell that downloads the sample video and replace with this:
# video_path = CACHE_FOLDER / "sample_video.mp4"
# url = "https://download.blender.org/durian/trailer/sintel_trailer-480p.mp4"
# download_file(url, video_path)

from google.colab import files
from pathlib import Path
import shutil

uploaded = files.upload()
filename = next(iter(uploaded))

video_path = CACHE_FOLDER / filename
shutil.move(filename, video_path)

df = model.get_events_dataframe(video_path=video_path)
display(df.head(8)[["type", "start", "duration", "filepath", "text", "context"]])
Run that cell — an Upload button will appear. Click it and select your video file from your computer.
Supported formats: MP4, MOV, AVIRecommended: Keep videos under 3 minutes for faster processing on free Colab
Step 9 — Run the Brain Analysis
Run these cells in order:
# Step 1: Extract the multimodal events from your video
df = model.get_events_dataframe(video_path=video_path)

# Step 2: Run brain prediction
preds, segments = model.predict(events=df)

print(f"Predictions shape: {preds.shape}")
# Output: (n_timesteps, n_vertices)
# n_timesteps = number of seconds in your video
# n_vertices = 20,000 brain surface points
This is the core step. TRIBE v2 is now predicting how a brain responds to every second of your video.
Note: TRIBE v2 outputs predictions offset by 5 seconds — this accounts for the natural delay between a stimulus and the brain's blood-flow response (hemodynamic lag). So second 10 in the output = the brain's reaction to second 5 of your video.
Step 10 — Visualize the Results
# Show the first 15 seconds of brain activity
plotter.plot(preds[:15], segments[:15], video_path=video_path)
This generates an interactive 3D brain heatmap synced to your video. You'll see:
- Red/warm colors = high activation (brain is engaged)
- Blue/cool colors = low activation (brain is disengaged)
- The map updates second by second as the video plays
Key brain regions to watch:
| Region | Location | What it means for your video |
|---|---|---|
| Dorsal attention network | Top/parietal | Viewer is actively paying attention |
| Visual cortex | Back of brain | Processing what they're seeing |
| Auditory cortex | Sides/temporal | Responding to sound/music |
| Default mode network | Spreads across midline | When this activates, mind is wandering — you're losing them |
| Hippocampus area | Medial temporal | Memory encoding — they'll remember this moment |
Step 11 — Get Second-by-Second Numbers
To get numerical data you can feed into Claude, run this:
import numpy as np

# Get mean activation across all brain regions for each second
activation_per_second = preds.mean(axis=1)

# Get the top region activation for each second
top_region_per_second = preds.max(axis=1)

# Print a simple table
print("Second | Mean Activation | Peak Activation")
print("-------|-----------------|----------------")
for i, (mean_val, peak_val) in enumerate(zip(activation_per_second, top_region_per_second)):
    print(f"  {i+1:3d}s | {mean_val:15.4f} | {peak_val:.4f}")
Copy this output — you'll paste it into Claude in Part 3.
Part 3: Connect to Claude — Find Your Best Version
This is where it gets powerful. You can run up to 10 versions of your video through TRIBE v2, collect the second-by-second activation data from each one, and then ask Claude which one wins and exactly why.
How to do it
For each video version, run Steps 8–11 and copy the output table. You'll end up with something like:
Video 1 (original cut):
Second | Mean Activation | Peak Activation
  1s   | 0.0234          | 0.1832
  2s   | 0.0198          | 0.1644
  3s   | 0.0156          | 0.1421
...

Video 2 (re-edited hook):
Second | Mean Activation | Peak Activation
  1s   | 0.0412          | 0.2981
  2s   | 0.0389          | 0.2754
...
The Claude Prompt (copy-paste this)
In Claude Code paste this:
You are a neuromarketing analyst. I ran multiple versions of my video through Meta's TRIBE v2 brain simulation model. Below is the second-by-second brain activation data for each version. TRIBE v2 was trained on 1,115 hours of fMRI data from 720 real people — high activation = brain is engaged, low activation = brain is checking out.Analyze each video version and tell me:
- Which version has the strongest overall brain engagement score
- Which version has the best opening 3 seconds (hook strength)
- Which version has the fewest attention drop-off moments
- The exact seconds where each video loses the viewer (activation drops below average)
- Your final recommendation: which version to post, and why
Here is the data:
[PASTE YOUR DATA HERE]
Claude will come back with a ranked analysis, tell you the winner, identify the exact seconds where each version loses attention, and give you concrete re-edit instructions.
Part 4: Re-Edit Based on What the Brain Says
Once Claude identifies your drop-off points, here's how to fix them:
| Problem the brain data shows | What to do in your edit |
|---|---|
| Activation drops in first 3s | Re-cut your hook — lead with the most visually striking frame you have |
| Sustained low activation in middle | Add a pattern interrupt: cut to a new angle, add text overlay, use a sound effect |
| Activation never fully recovers after drop | Remove the dead section entirely — it's killing the rest |
| Activation high but drops at the end | Your CTA is weak — add urgency, movement, or a direct question |
| Default mode network activating | Your visuals are too static — add motion, zooms, or jump cuts |
| Audio regions flat | Your audio is too monotone — vary pace, add music, or cut silence |
Run the re-edited version back through TRIBE v2. Compare the new activation data against the original. Repeat until the brain stays engaged.
Quick Reference Links
| Resource | Link |
|---|---|
| Official Colab Notebook | Open in Colab |
| GitHub Repository | facebookresearch/tribev2 |
| Model on Hugging Face | facebook/tribev2 |
| Llama 3.2 Access Request | meta-llama/Llama-3.2-3B |
| Interactive Demo | aidemos.atmeta.com/tribev2 |
| Meta Research Blog | ai.meta.com/blog/tribe-v2 |
| Original Paper (arXiv) | arxiv.org/abs/2507.22229 |
Common Issues & Fixes
"CUDA out of memory" error
→ Your GPU ran out of VRAM. Upgrade to Colab Pro and switch to A100 GPU. The full model needs ~30GB.
"Access to model is restricted" on Hugging Face
→ You haven't been approved for Llama yet. Wait for the approval email (up to 2 hours) or check your HuggingFace email inbox for the confirmation.
"HF_TOKEN not found" error
→ Go back to the 🔑 key icon in the Colab sidebar and make sure you added the secret with the exact name HF_TOKEN (all caps, underscore).
Upload button doesn't appear
→ Make sure you commented out the sample video download lines before running the upload cell.
Predictions look the same for every second
→ Your video might be too short (under 10 seconds) or the model needs more frames. Try a video that's at least 30 seconds.
Runtime disconnects mid-run
→ Colab free tier disconnects after 90 minutes of inactivity. Either upgrade to Pro or keep the tab active. The model weights are cached in ./cache — you don't need to re-download them if you reconnect.
What the Numbers Actually Mean
TRIBE v2 outputs values on the cortical surface — each number represents predicted BOLD signal (Blood Oxygen Level Dependent), which is what an fMRI scanner measures.
- Higher values = more oxygenated blood flowing to that brain region = more neural activity = more engagement
- Lower values = less activity = the brain is in a resting or wandering state
You don't need to understand neuroscience to use this. The pattern is simple: watch for the dips. Every time the mean activation drops below the baseline for your video, that's a second your viewer's brain is checking out.
The goal is a graph that stays high, climbs at key moments, and never flatlines.